UNITED STATES
SECURITIES AND EXCHANGE COMMISSION
Washington, D.C. 20549
SCHEDULE 14A
Proxy Statement Pursuant to Section 14(a) of
the Securities Exchange Act of 1934 (Amendment No. )
Filed by the Registrant ☒
Filed by a Party other than the Registrant ☐
Check the appropriate box:
| Preliminary Proxy Statement | ||
☐ | Confidential, for Use of the Commission Only (as permitted by Rule 14a-6(e)(2)) |
| ☒ | Definitive Proxy Statement |
☐ | Definitive Additional Materials |
☐ | Soliciting Material pursuant to §240.14a-12 |
| BEST BUY CO., INC. | |||||
| (Name of Registrant as Specified In Its Charter) | |||||
| (Name of Person(s) Filing Proxy Statement, if other than the Registrant) | |||||
Payment of Filing Fee (Check all boxes that apply):
| | | No fee | ||||
| | | Fee paid previously with preliminary materials | ||||
| ☐ | | | Fee computed on table | |||
| | |||||
| | | ||||
 | BEST BUY CO., INC. | ||||
7601 Penn Avenue South Richfield, Minnesota 55423 | | | |||
| | |||||
| | ||||||||
| Time: | | | 9:00 a.m., Central Time, on | | ||||
| | Place: | | | | ||||
| | Internet: | | | Submit pre-meeting questions online by visiting www.proxyvote.comand | | |||
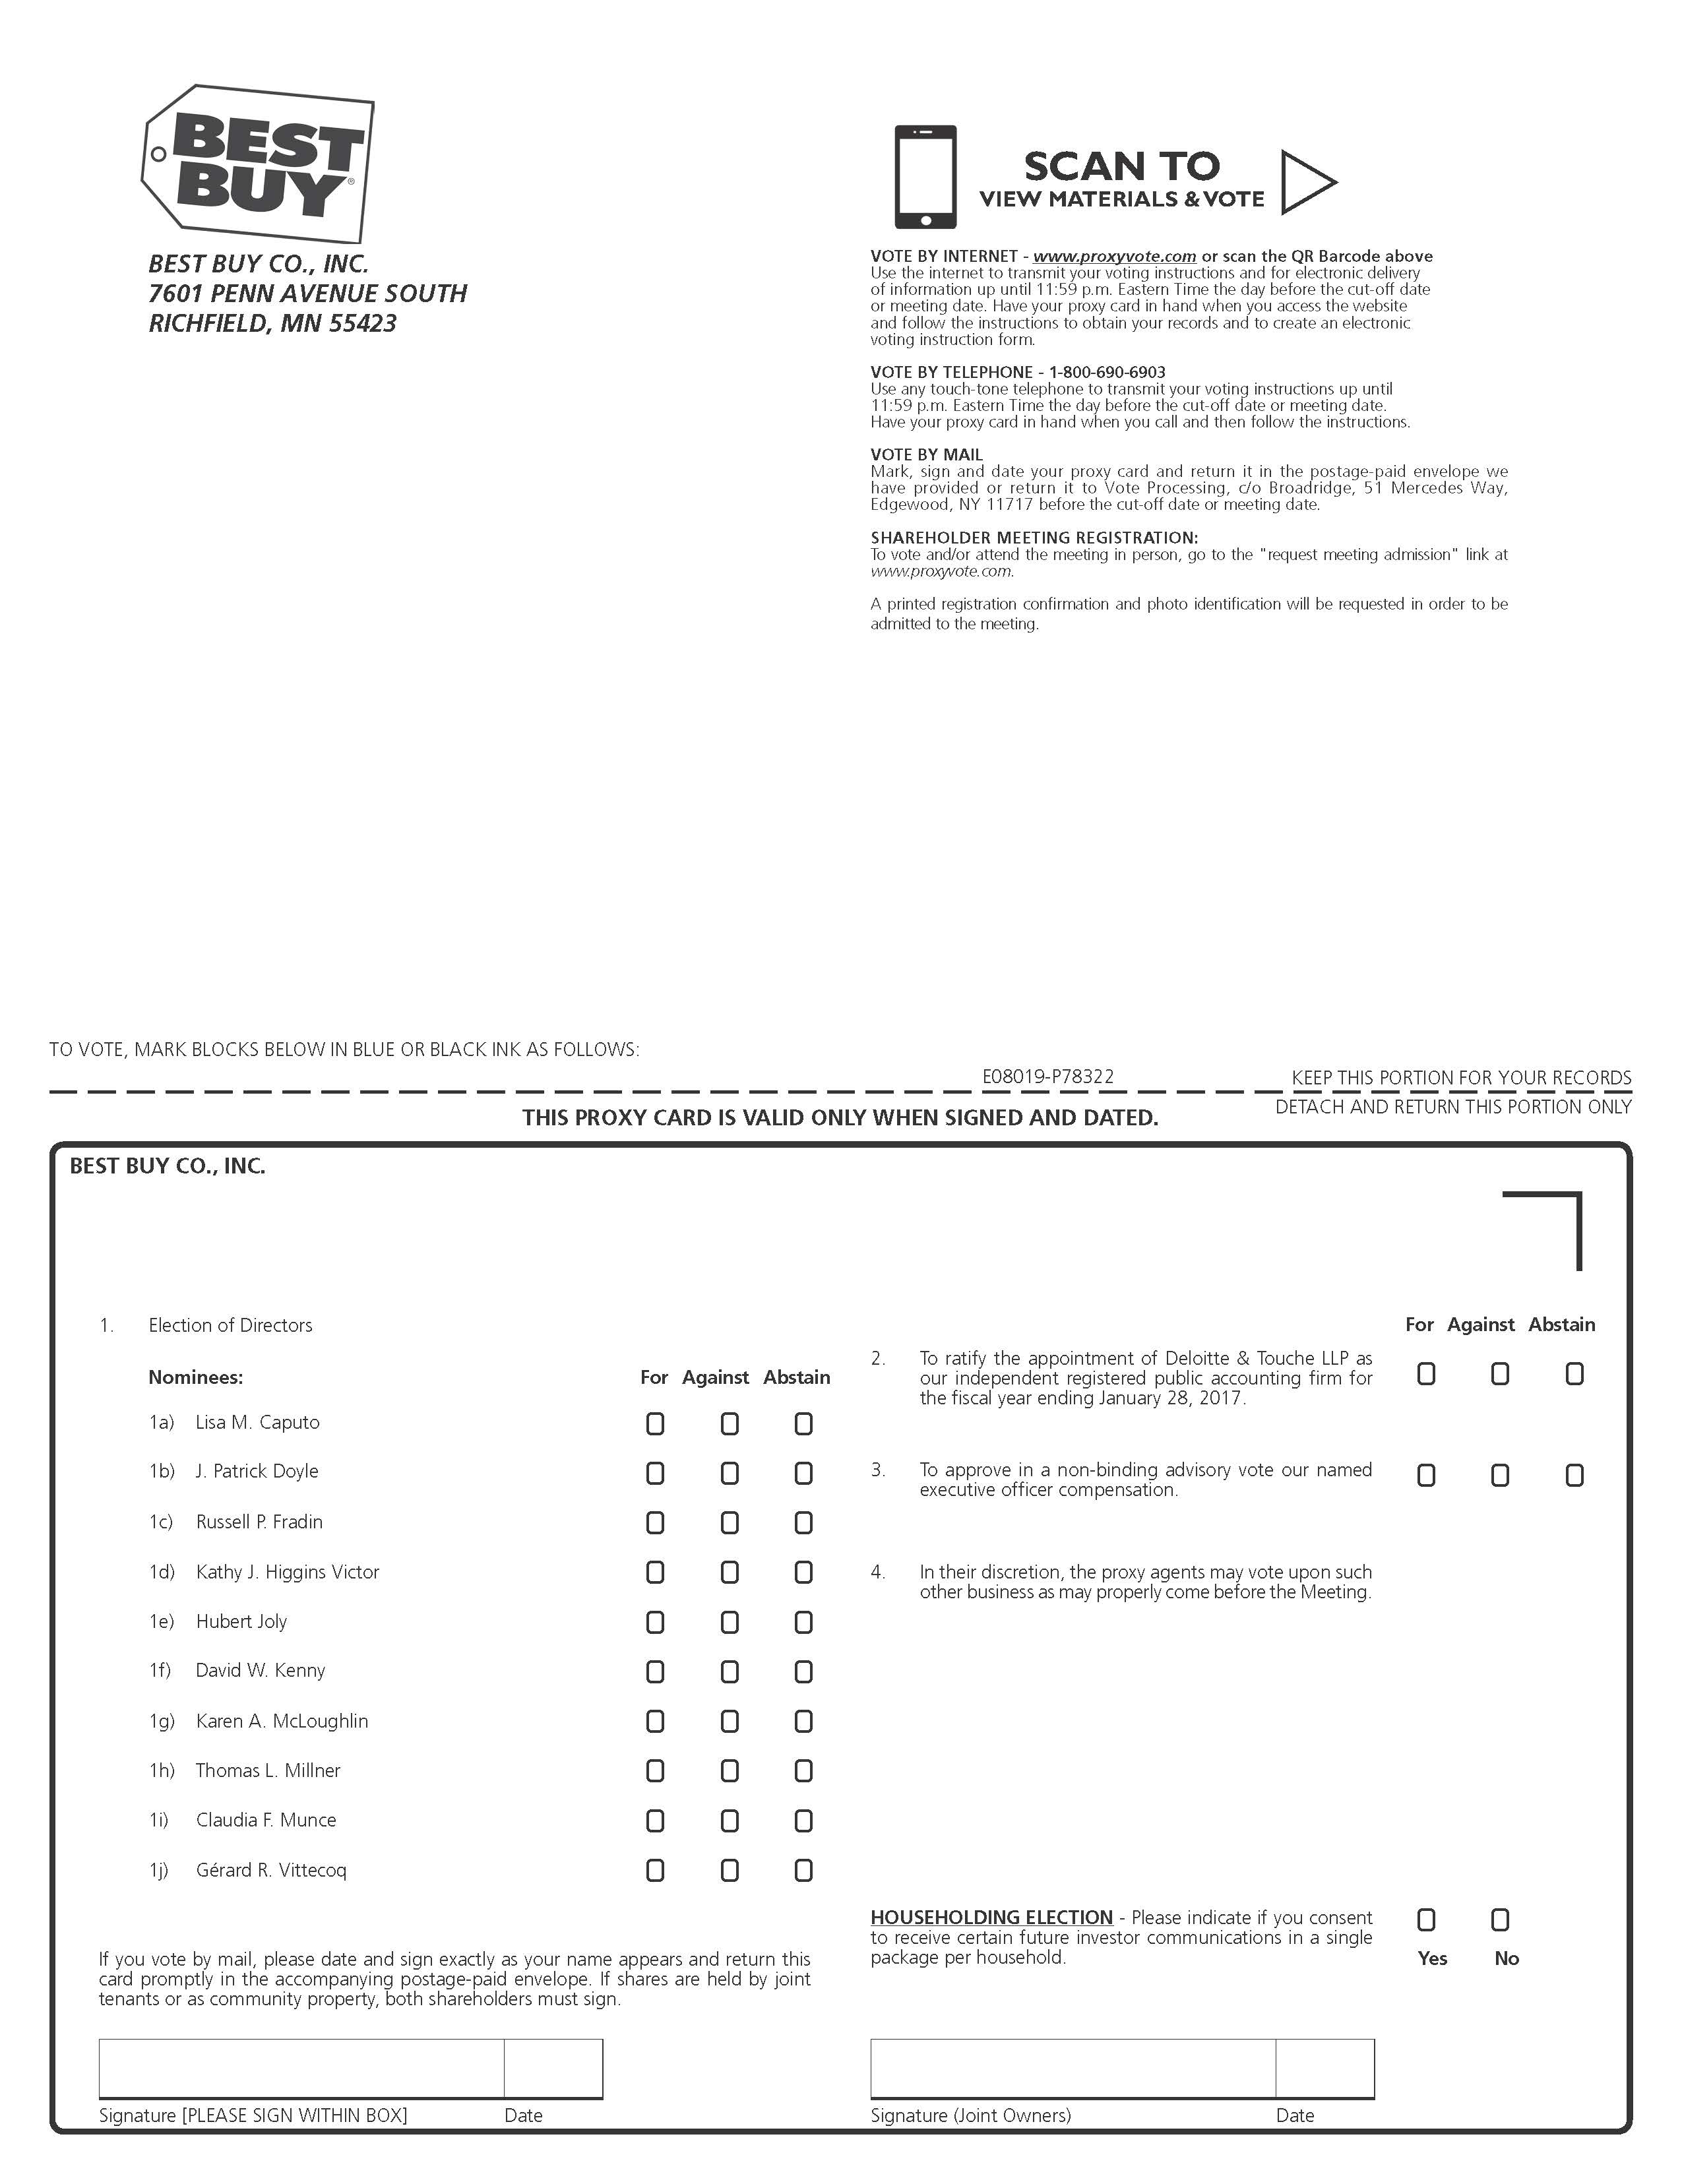
| | Items of Business: | | | 1. | | | To elect the | |
| | | | 2. | | | To ratify the appointment of Deloitte & Touche LLP as our independent registered public accounting firm for the fiscal year ending | | |
| | | | 3. | | | To conduct a non-binding advisory vote to approve our named executive officer compensation. | | |
| | | | 4. | | | To vote on a shareholder proposal, if properly presented at the meeting. | | |
| | | | 5. | | | To transact such other business as may properly come before the meeting. | | |
| | Record Date: | | | You may vote if you were a shareholder of Best Buy Co., Inc. as of the close of business on Monday, April | | |||
| | Proxy Voting: | | | Your vote is important. You may vote via proxy as a shareholder of record: | | |||
| | | | 1. | | | By visiting www.proxyvote.com on the internet; | | |
| | | | 2. | | | By calling (within the U.S. or Canada) toll-free at 1-800-690-6903; or | | |
| | | | 3. | | | By signing and returning your proxy card if you have received paper materials. | | |
For shares held through a broker, bank or other nominee, you may vote by submitting voting instructions to your broker, bank or other nominee.
Regardless of whether you expect to attend the meeting, in person, please vote your shares in one of the ways outlined above.
| | |||||
| | |||||
| | By Order of the Board of Directors | | |||
| | | |   | | |
| | Richfield, Minnesota | | Todd G. Hartman | | |
| April 30, 2024 | | | Secretary | |
| | |
IMPORTANT NOTICE REGARDING THE AVAILABILITY OF PROXY MATERIALS FOR THE REGULAR MEETING OF SHAREHOLDERS TO BE HELD ON JUNE | |
| | This Notice of Form 10-K for the fiscal year ended |
Help us make a difference by eliminating paper proxy mailings to your home or business. As permitted by rules adopted by the U.S. Securities and Exchange Commission (“SEC”), we are furnishing proxy materials to our shareholders primarily via the internet. On or about April 30, 2024, we mailed or otherwise made available to our shareholders a Notice of Internet Availability containing instructions on how to access our proxy materials, including our proxy statement and our Annual Report. The Notice of Internet Availability also includes instructions to access your form of proxy to vote via the internet. Certain shareholders, in accordance with their prior requests, have received e-mail notification of how to access our proxy materials and vote via the internet or have been mailed paper copies of our proxy materials and proxy card.
Internet distribution of our proxy materials is designed to expedite receipt by our shareholders, lower the cost of the Regular Meeting of Shareholders and conserve precious natural resources. If you would prefer to receive paper proxy materials, please follow the instructions included in the Notice of Internet Availability. If you have previously elected to receive our proxy materials electronically, you will continue to receive e-mail notification with instructions to access these materials via the internet unless you elect otherwise.
ATTENDING THE REGULAR MEETING OF SHAREHOLDERS
| • | We invite you to attend the 2024 Regular Meeting of Shareholders (the “Meeting”) virtually. There will not be a physical meeting. You will be able to attend the Meeting virtually, vote your shares electronically, and submit your questions during the Meeting by visiting: www.virtualshareholdermeeting.com/BBY2024 and following the instructions on your proxy card. |
The Meeting starts at 9:00 a.m. Central Time.
You do not need to attend the meetingMeeting online to vote if you submitted your vote via proxy in advance of the meeting.Meeting.
| • | A replay of the Meeting will be available on www.investors.bestbuy.com. |
Dear Shareholders,
It is our honor to share with you the progress Best Buy has made during fiscal year 2024.
First, we wanted to provide you with some updates regarding the composition of our Board of Directors. On June 12, 2024, Patrick will retire from the Board after serving as chair since 2020 and as a replayBoard member since 2014. On that day, David, who has served as a director since 2013, will assume the role of chair. Additionally, Eugene Woods will be available until June 28, 2016.retiring from the Board, and we thank him for his guidance and service during his time with the Board. We were proud that David Kimbell, Chief Executive Officer of Ulta Beauty, joined the Board last summer. We have both confidence and appreciation for the leadership of this Board as fiscal year 2025 unfolds.
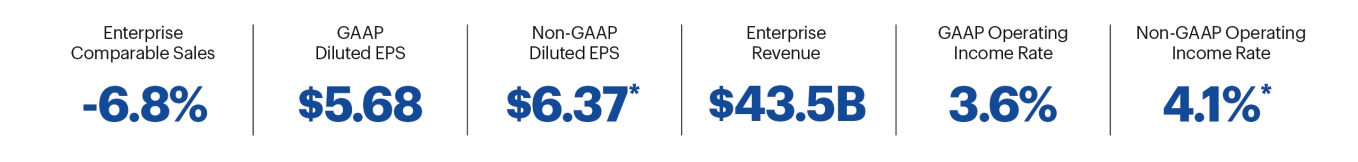
As expected, fiscal year 2024 provided a challenging landscape for our business as broad macroeconomic challenges persisted for our customers. Despite those headwinds, Best Buy’s leadership team and employees remained focused on the Company’s strategy. They delivered strong profitability through disciplined operational execution and commitment to creating amazing customer experiences.
Like we anticipated, strategic investments made in the business last fiscal year showed positive results and operating income improvements. Specifically, the two paid tiers of the My Best Buy membership program ended fiscal year 2024 with 7 million members, which represents a 20% increase over the previous year. Additionally, Best Buy Health expanded strategic partnerships with some of the nation’s largest health systems.
In fiscal year 2024, Best Buy returned $1.1 billion to shareholders through dividends and share repurchases. Remaining steadfast in our commitment to being a premium dividend payer, the Company increased its fiscal year 2025 quarterly dividend by 2% to $0.94 per share. We have raised our quarterly dividend for 11 consecutive years.
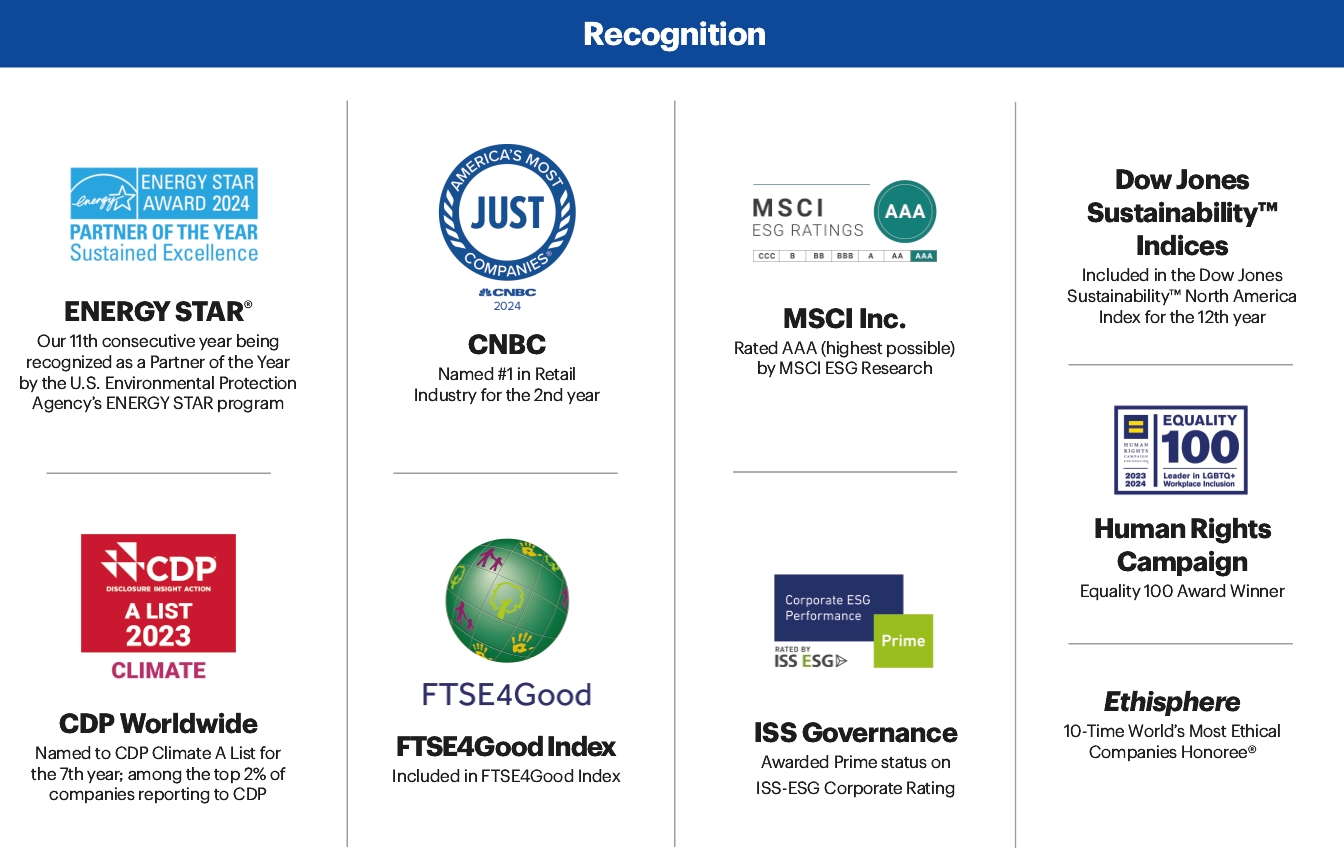
We are also proud to be recognized for our work in support of our employees and the environment, and we strongly believe our investment in these areas creates long-term shareholder value. Best Buy was once again named the No. 1 retailer on the JUST Capital list, which evaluates and ranks the largest publicly traded companies in the U.S. based, in part, on how a company invests in its employees. For the seventh consecutive year, Best Buy was recognized on CDP’s prestigious Climate A List, which looks at best practices associated with environmental leadership. Finally, the Company remained on the annual Dow Jones Sustainability North America Index for the 12th year.
Looking ahead, we believe increasing stabilization in the consumer electronics industry will create an exciting environment for Best Buy to continue to deliver on its purpose of enriching lives through technology by using our unique strengths to grow the business.
Our CEO, Corie Barry, and her leadership team have clearly and repeatedly shown their skill of managing near-term challenges while positioning the Company for long-term growth. We are incredibly confident in the strategy and in the more than 85,000 employees who are working hard to bring it to life to build shareholder value.
In conclusion, we would like to thank every employee of Best Buy for their enduring commitment to our customers, partners and communities. It is our privilege to work with them to help the Company pursue its purpose and generate continued value for its stakeholders.
Thank you for your continued support of this great Company,
| | | | | ||
| | | | | ||
| |  | | |  | |
| | | | | ||
| | Patrick Doyle, Chair of the Board | | | David Kenny, Chair of the Board - Elect | |
TABLE OF CONTENTS
| | | |||||
| | | |||||
| | | |||||
| | | | | | | | | |||||
| | | 2024 Proxy Statement | | | | | | |
| | | PAGE | |
| | | ||
| | | ||
| | | ||
| | | ||
| | | ||
| | | ||
| | | ||
| | | ||
| | | ||
| | | ||
| | | ||
| | | ||
| | | ||
| | | ||
| | | ||
| | | ||
| | | ||
| | | ||
| | | ||
| | | ||
| | | ||
| | | ||
| | | ||
| | | ||
| | | ||
| | | ||
| | | ||
| | |
CAUTIONARY STATEMENT PURSUANT TO THE
PRIVATE SECURITIES LITIGATION REFORM ACT OF 1995
Section 27A of the Securities Act of 1933, as amended (“Securities Act”), and Section 21E of the Securities Exchange Act of 1934, as amended (“Exchange Act”), provide a “safe harbor” for forward-looking statements to encourage companies to provide prospective information about their companies. With the exception of historical information, the matters discussed in this proxy statement on Schedule 14A are forward-looking statements and may be identified by the use of words such as “anticipate,” “appear,” “approximate,” “assume,” “believe,” “continue,” “could,” “estimate,” “expect,” “foresee,” “guidance,” “intend,” “may,” “might,” “outlook,” “plan,” “possible,” “project” “seek,” “should,” “would,” and other words and terms of similar meaning or the negatives thereof. Such statements reflect our current view with respect to future events and are subject to certain risks, uncertainties and assumptions. A variety of factors could cause our future results to differ materially from the anticipated results expressed in such forward-looking statements. Readers should review Item 1A, Risk Factors, of our most recently filed Annual Report on Form 10-K for a description of important factors that could cause our future results to differ materially from those contemplated by the forward-looking statements made in this proxy statement on Schedule 14A. Our forward-looking statements speak only as of the date of this proxy statement or as of the date they are made, and we undertake no obligation to update our forward-looking statements.
| | | | | | | | | |||||
| | | | | | | | | 2024 Proxy Statement |

At our 2024 Regular Meeting of Shareholders, we are asking shareholders to vote on four key items. This section highlights information contained in other parts of this proxy statement. We encourage you to review the entire proxy statement for more detail on these items, as well as our Annual Report and our CEO’s Letter to Shareholders posted on our website at www.investors.bestbuy.com.
Items of Business for Vote at our Regular Meeting of Shareholders
This year, we are requesting your support for the following Items of Business:
| | Item Number | | | Item Description | | | Board Recommendation | |
| | 1 | | | Election of Directors | | | FOR Each Nominee | |
| | | | We have eleven director nominees standing for election this year. More information about our nominees’ qualifications and experience can be found starting on page 26. | | | | ||
| | 2 | | | Ratification of Appointment of our Independent Registered Public Accounting Firm | | | FOR | |
| | | | We are asking our shareholders to ratify the appointment of Deloitte & Touche LLP as our independent registered public accounting firm for fiscal 2025, as described on page 47. | | | | ||
| | 3 | | | Advisory Vote to Approve Named Executive Officer Compensation | | | FOR | |
| | | | We are seeking, in an advisory capacity, approval by our shareholders of our named executive officer compensation, the “Say on Pay” vote. Our Compensation Discussion & Analysis (“CD&A”), which begins on page 49, describes our executive compensation programs and decisions for fiscal 2024. | | | | ||
| | 4 | | | Shareholder Proposal - Shareholder Opportunity to Vote on Excessive Golden Parachutes, if properly presented | | | AGAINST | |
| | | | We are seeking your vote against the shareholder proposal requesting that our Board adopt a policy to seek shareholder approval of any senior manager’s new or renewed pay package that provides for golden parachute payments with an estimated value exceeding 2.99 times the sum of the executive’s base salary plus target short-term bonus. The proposal and our opposition statement can be found starting on page 83. | | | |
Attending the Meeting
How will the Meeting be conducted?
The Meeting will be conducted online, in a fashion similar to an in-person meeting. Our Board members and executive officers will attend the Meeting and be available for questions. You may attend the Meeting online, vote your shares electronically, and submit your questions during the Meeting by visiting our virtual shareholder forum at www.virtualshareholdermeeting.com/BBY2024 and following the instructions on your proxy card.
| | | | | | | | | |||||
| | | | | 1 | | | | | 2024 Proxy Statement |
How can I ask questions during the Meeting?
Questions may be submitted prior to the Meeting, or you may submit questions during the Meeting through our virtual shareholder forum. We are committed to acknowledging questions we receive in the time allotted. We will allot approximately fifteen minutes for questions during the Meeting and submitted questions should follow our Rules of Conduct in order to be addressed during the Meeting. If we are unable to answer your question during the Meeting due to time constraints, you are encouraged to contact the Best Buy Investor Relations department at investorrelations@bestbuy.com. Our Rules of Conduct are posted on the forum.
What can I do if I need technical assistance during the Meeting?
If you encounter any difficulties accessing the virtual Meeting during the check-in or Meeting time, please call the technical support number that will be posted on the Virtual Shareholder Meeting log-in page.
If I can’t attend the Meeting, can I vote or listen to it later?
You do not need to attend the online Meeting to vote if you submitted your vote via proxy in advance of the Meeting. A replay of the Meeting, including the questions answered during the Meeting, will be available on www.investors.bestbuy.com.
Additional information about how to vote your shares and attend our Meeting can be found in the General Information section of this proxy statement.
Corporate Governance
Our longstanding approach to corporate governance is to develop and implement principles that: (1) enable the success of our strategy and business objectives; (2) are rooted in a robust ongoing dialogue with our shareholders; and (3) are inspired by best practices. Consistent with this approach, we continue to build upon a strong framework of corporate governance policies and practices, including the following:
| | Board Structure | | | | | | |||||
| | • | | | Independent Chair | | | • | | | All Independent Committees | |
| | • | | | Annual Director Elections | | | • | | | No Director Related Party Transactions | |
| | • | | | Robust Annual Board Evaluation Process | | | • | | | Director Overboarding Policy | |
| | • | | | Majority Vote for Directors | | | • | | | Director Retirement Policy | |
| | | | | | | | | | |||
| | Shareholder Rights | | | Compensation | | ||||||
| | • | | | No Cumulative Voting Rights | | | • | | | Pay for Performance Compensation Programs | |
| | • | | | No Poison Pill | | | • | | | Anti-Hedging and Anti-Pledging Policies | |
| | • | | | Proxy Access By-Laws | | | • | | | Clawback Policies for both Cash and Equity Awards, Including a Policy Compliant with the Dodd-Frank Act | |
| | • | | | No Supermajority Voting Provisions in our Articles of Incorporation (“Articles”) | | | • | | | Stock Ownership Guidelines for Directors and Executives | |
| | • | | | No Exclusive Forum/Venue or Fee-Shifting Provisions | | | | | | ||
Additional information on our Corporate Governance policies and practices can be found in the Corporate Governance at Best Buy section of this proxy statement.
| | | | | | | | | |||||
| | | 2024 Proxy Statement | | | 2 | | | | |
Corporate Responsibility & Sustainability
Our Board, with oversight by the Nominating, Corporate Governance and Public Policy Committee (the “Nominating Committee”), is integrally involved in the Company’s corporate responsibility and sustainability (“CR&S”) initiatives. We are an organization built upon values-driven leadership and we are focused on our purpose to enrich lives through technology. We are dedicated to addressing issues that impact our people, communities and the planet. We are honored to be recognized for the progress we have made in building a better world with all of our stakeholders. Please see our annual CR&S Report, available at https://corporate.bestbuy.com/sustainability under “About Us” for more details.
Additional information regarding our purpose and programs relating to our CR&S efforts can be found in the Corporate Governance at Best Buy — Corporate Responsibility and Sustainability section of this proxy statement.
| | | | | | | | | |||||
| | | | | 3 | | | | | 2024 Proxy Statement |
Item No. 1: Election of Directors
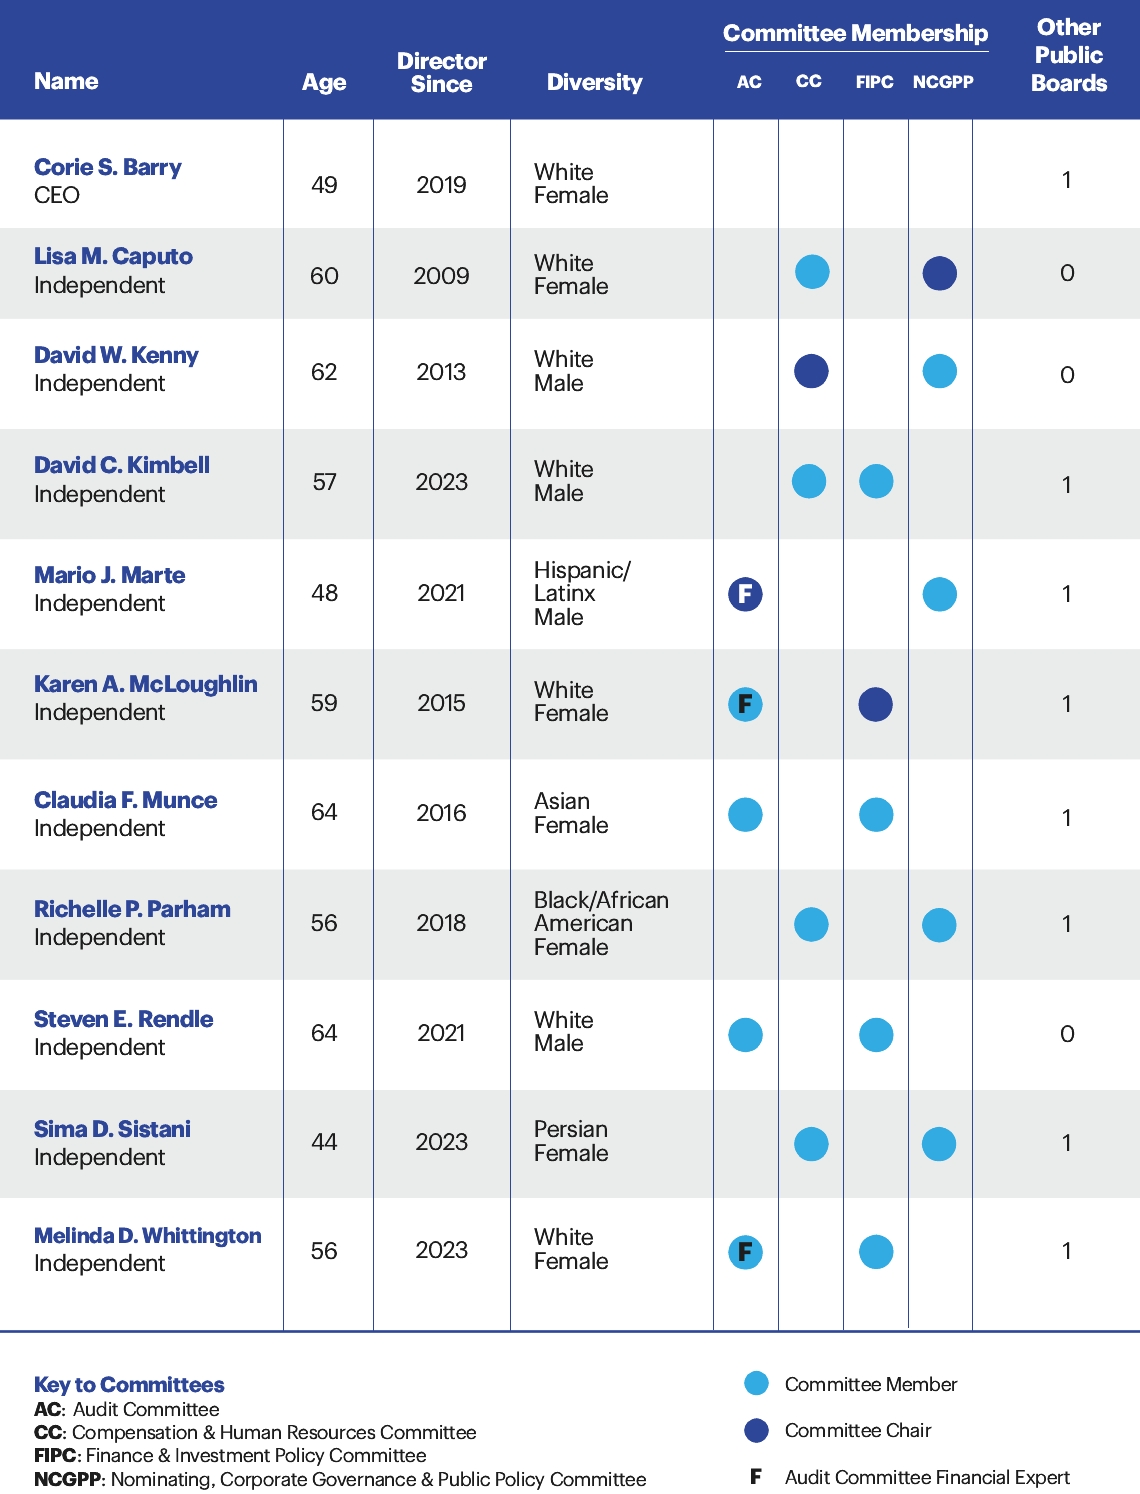
The following individuals are standing for election to our Board. The Board recommends a vote FOR each of the nominees. All nominees are current members of the Board.
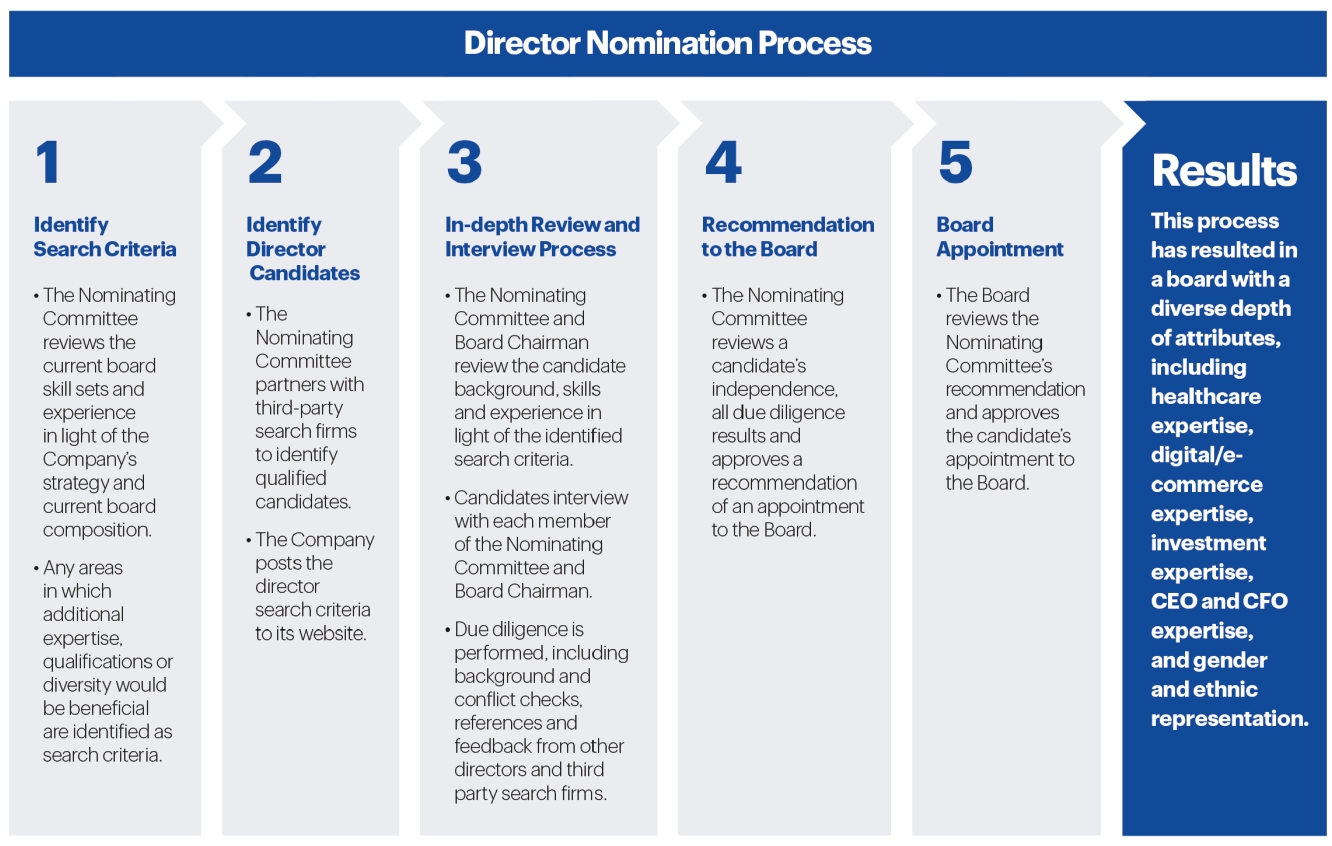
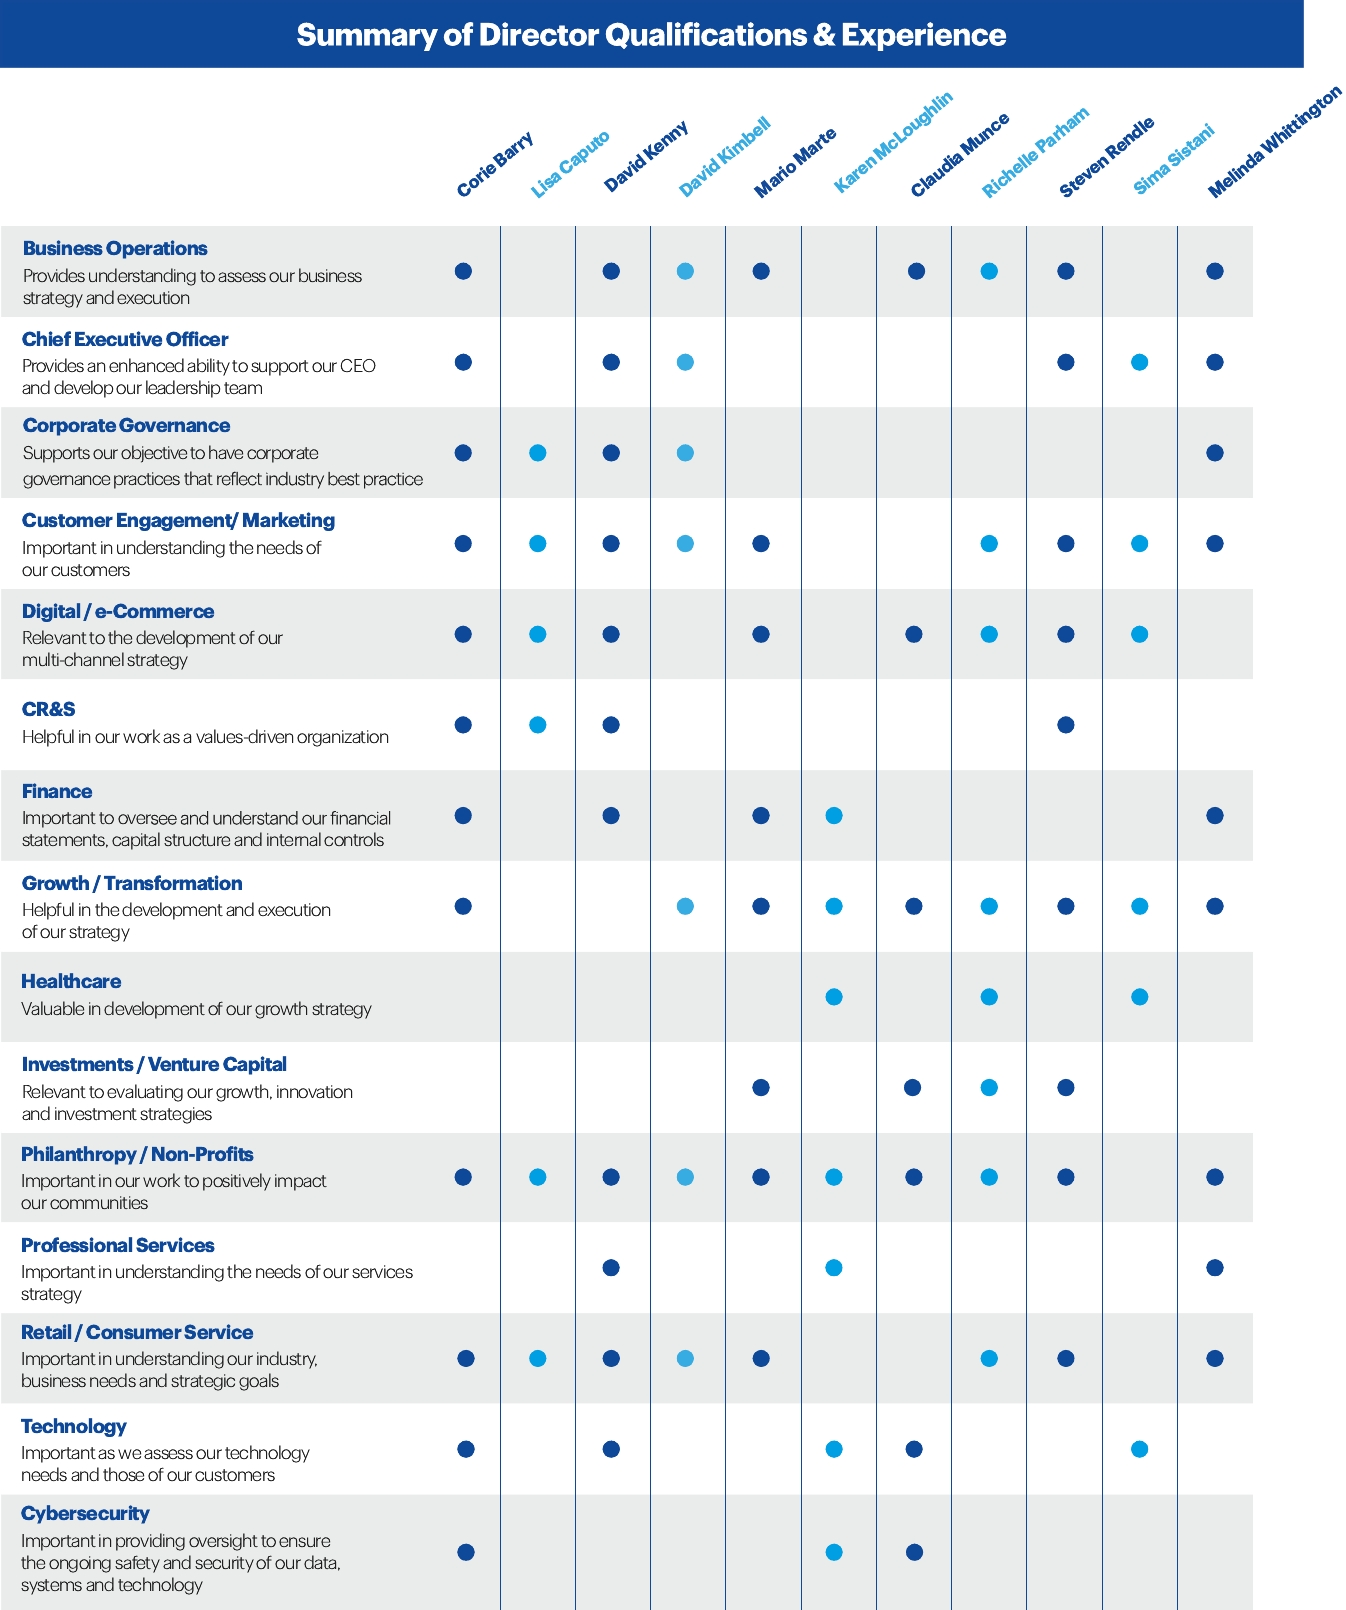
The Board seeks a wide range of experience and expertise from a variety of industries and professional disciplines in its directors and carefully assesses and plans for the director skill sets, qualifications and diverse perspectives required to support the Company’s long-term strategic goals. Our slate of director nominees reflects the strong results of these efforts.
| | | | | | | | | |||||
| | | 2024 Proxy Statement | | | 4 | | | | |
Additional information about each of our nominees and director qualification and nomination process can be found in Item of Business No. 1 — Election of Directors.
Item No. 2: Ratification of Appointment of our Independent Registered Public Accounting Firm
The Board recommends a vote FOR ratification of Deloitte & Touche LLP as our independent registered public accounting firm for the fiscal year ending February 1, 2025.
Deloitte & Touche LLP (“D&T”) served as our auditors for fiscal 2024. Our Audit Committee has selected D&T to audit our financial statements for fiscal 2025 and is submitting its selection of our independent registered public accounting firm for ratification by the shareholders in order to ascertain the view of our shareholders on this selection. The following table summarizes the aggregate fees incurred for services rendered by D&T during fiscal 2024 and fiscal 2023. Additional information can be found in Item of Business No. 2 — Ratification of Appointment of our Independent Registered Public Accounting Firm.
| | Service Type | | | Fiscal 2024 | | | Fiscal 2023 | |
| | Audit Fees | | | $3,665,000 | | | $3,420,000 | |
| | Audit-Related Fees | | | 364,000 | | | 382,000 | |
| | Tax Fees | | | 0 | | | 45,000 | |
| | Other Fees | | | 11,000 | | | 0 | |
| | Total Fees | | | $4,040,000 | | | $3,847,000 | |
Item No. 3: Say-on-Pay: Advisory Vote to Approve Named Executive Officer Compensation
The Board recommends a vote FOR approval of our named executive officer (“NEO”) compensation.
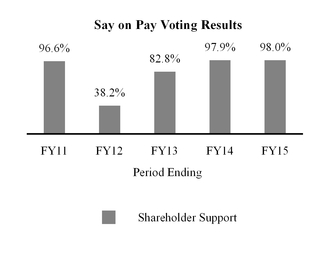
Our shareholders have consistently strongly supported our executive compensation program. For the last five years, our average Say-on-Pay vote has been 93.8%. We believe this support reflects our strong pay-for-performance philosophy, our commitment to sound compensation policies, and our active engagement and open dialogue with our shareholders. The Compensation Committee regularly takes feedback received from shareholders into consideration when making decisions regarding our executive compensation program.
| | | | | | | | | |||||
| | | | | 5 | | | | | 2024 Proxy Statement |
Our executive compensation program contains the following elements:
| | Compensation Component | | | Key Characteristics | | | Purpose | |
| | Base Salary | | | Cash | | | Provide competitive, fixed compensation to attract and retain executive talent. | |
| | Short-Term Incentive | | | Cash award paid based on achievement of various performance metrics | | | Create a strong financial incentive for achieving or exceeding Company performance goals. | |
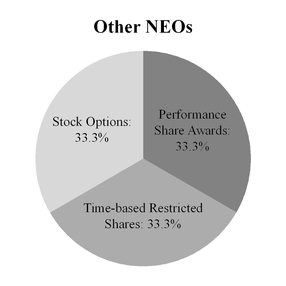
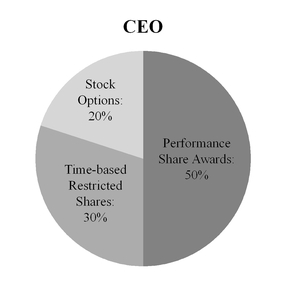
| | Long-Term Incentive | | | Stock options, performance-conditioned time-based restricted shares, time-based restricted shares and performance share awards | | | Create a strong financial incentive for increasing shareholder value, encourage ownership stake, and promote retention. | |
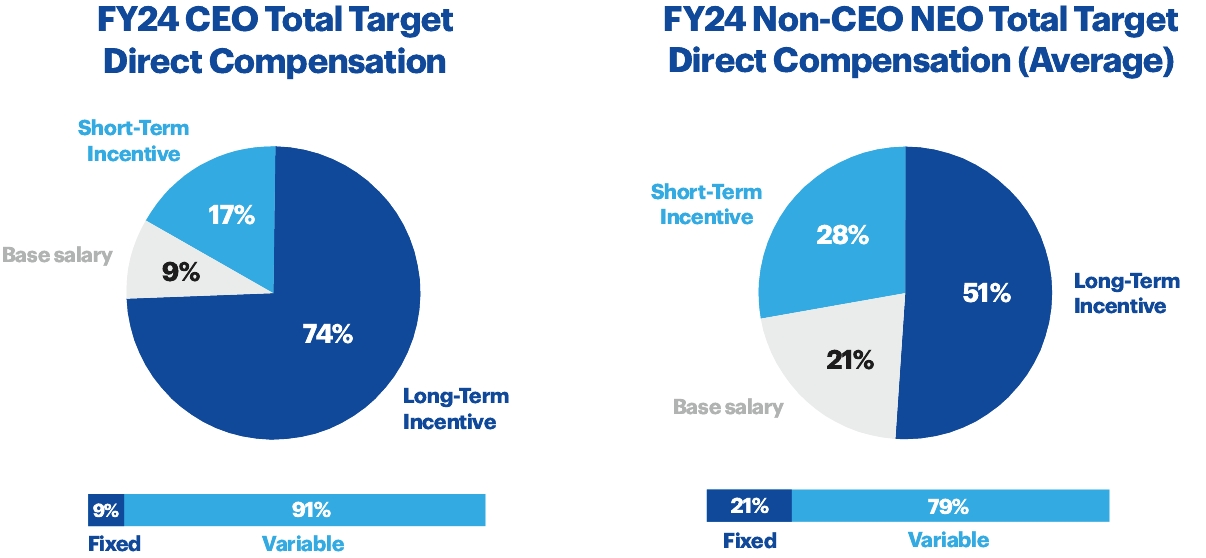
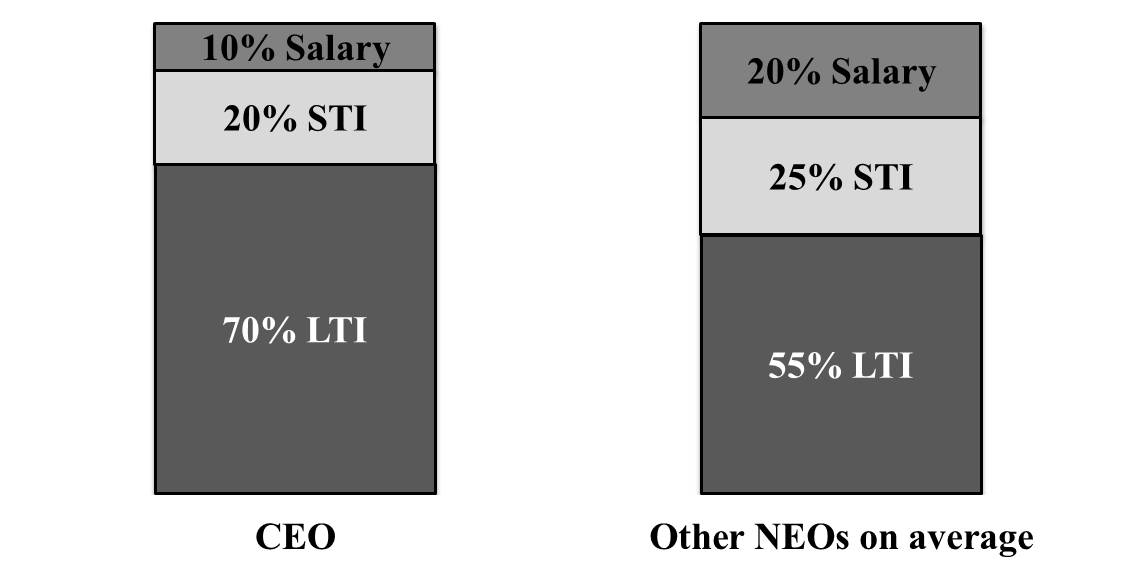
Pay is tied to performance. The majority of target executive compensation is not guaranteed and is based on performance metrics designed to drive shareholder value, as summarized below for the CEO and other NEOs (excluding the CEO).
Additional information can be found in Item of Business No. 3 — Advisory Vote to Approve Named Executive Officer Compensation and the Compensation Discussion and Analysis sections of this proxy statement.
| | | | | | | | | |||||
| | | 2024 Proxy Statement | | | 6 | | | | |
Item No. 4: Shareholder Proposal- Shareholder Opportunity to Vote on Excessive Golden Parachutes
The Board recommends a vote AGAINST the shareholder proposal requesting that our Board adopt a policy to seek shareholder approval of any senior manager’s new or renewed pay package that provides for golden parachute payments with an estimated value exceeding 2.99 times the sum of the executive’s base salary plus target short-term bonus.
Additional information can be found in Item of Business No. 4 — Shareholder Proposal – Shareholder Opportunity to Vote on Excessive Golden Parachutes section of this proxy statement.
| | | | | | | | | |||||
| | | | | 7 | | | | | 2024 Proxy Statement |
BEST BUY CO., INC.
7601 Penn Avenue South
Richfield, Minnesota 55423
PROXY STATEMENT
REGULAR MEETING OF SHAREHOLDERS — JUNE 14, 201612, 2024
This proxy statement is furnished in connection with the solicitation of proxies by the Board of Directors ("Board"(“Board”) of Best Buy Co., Inc. ("(“Best Buy," "we," "us," "our"” “we,” “us,” “our” or the "Company"“Company”) to be voted at our 20162024 Regular Meeting of Shareholders (the "Meeting"“Meeting”) to be held virtually on Tuesday,Wednesday, June 14, 2016,12, 2024, at 9:00 a.m., Central Time, at the Best Buy Corporate Campus — Convention Center, 7601 Penn Avenue South, Richfield, Minnesota, 55423www.virtualshareholdermeeting.com/BBY2024 or at any postponement or adjournment of the Meeting. TheOn or about April 30, 2024, we mailed or made available our proxy materials, including the proxy statement, our Annual Report and form of proxy or the Notice of Internet Availability, were mailed to you beginning on or about May 3, 2016.
Availability.
Background
What is the purpose of the Meeting?
At the Meeting, shareholders will vote on the items of business outlined in the Notice of 20162024 Regular Meeting of Shareholders ("(“Meeting Notice"Notice”) included as the cover page to this proxy statement. In addition, management will reportprovide a brief update on our business and respond to questions from shareholders.
Why did I receive this proxy statement and a proxy card or the Notice of Internet Availability?
You received this proxy statement and a proxy card or the Notice of Internet Availability because you owned shares of Best Buy common stock as of April 18, 2016,15, 2024, the record date for the Meeting and are entitled to vote on the items of business at the Meeting. This proxy statement describes the items of business that will be voted on at the Meeting and provides information on these items so that you can make an informed decision.
How can I attend the Meeting?
You can attend the Meeting online by logging on to www.virtualshareholdermeeting.com/BBY2024 and following the instructions provided on your proxy or notice card.
How will the Meeting be conducted?
The Meeting will be conducted online, in a fashion similar to an in-person meeting. Our Board members and executive officers will attend the Meeting and be available for questions. You will need a formbe able to attend the Meeting online, vote your shares electronically, and submit your questions during the Meeting by visiting our virtual shareholder forum at: www.virtualshareholdermeeting.com/BBY2024 and following the instructions on your proxy card.
How can I ask questions during the Meeting?
Questions may be submitted prior to the Meeting through our virtual shareholder forum at www.virtualshareholdermeeting.com/BBY2024, or you may submit questions during the Meeting through the forum. We are committed to acknowledging questions we receive in the time allotted. We will allot approximately fifteen minutes for questions during the Meeting and submitted questions should follow our Rules of personal identification (such as a driver's license) along with either your Notice of Internet Availability, proxy card or proof of stock ownershipConduct for the Meeting in order to enterbe addressed during the Meeting. If we are unable to answer your shares are held beneficially in the name of a bank, broker or other holder of record and you wish to be admitted toquestion during the Meeting due to time constraints, you must present proof of your ownership ofare encouraged to contact the Best Buy stock, such as a bankInvestor Relations department at investorrelations@bestbuy.com. Our Rules of Conduct are posted on the forum.
What can I do if I need technical assistance during the Meeting?
If you encounter any difficulties accessing the virtual Meeting during the check-in or brokerage account statement. Please noteMeeting time, please call the technical support number that no cameras, recording equipment, electronic devices, large bags, briefcases or packages will be permittedposted on the virtual shareholder Meeting log-in page.
| | | | | | | | | |||||
| | | 2024 Proxy Statement | | | 8 | | | | |
If I can’t attend the Meeting, can I vote or listen to it later?
You do not need to attend the online Meeting to vote if you submitted your vote via proxy in advance of the Meeting.
A replay of the Meeting, including the questions answered during the Meeting, will be available on www.investors.bestbuy.com.
Who may vote?
In order to vote at the Meeting, you must have been a shareholder of record of Best Buy as of the close of business on Monday, April 18, 2016,15, 2024, which is the record date for the Meeting. If your shares are held in "street name"“street name” (that is, through a bank, broker or other nominee), you will receive instructions from the bank, broker or nominee that you must follow in order for your shares to be voted as you choose.
When is the record date?
The Board has established the close of business on Monday, April 18, 2016,15, 2024, as the record date for the Meeting.
How many shares of Best Buy common stock are outstanding?
As of the record date, there were 324,078,217216,352,418 shares of Best Buy common stock outstanding. There are no other classes of capital stock outstanding.
Voting Procedures
voting on, how many votes are required to approve each item, how are votes counted and how does the Board recommend I vote:
| | Item | | | Vote Required | | | Voting Options | | | Board Recommendation(1) | | | Broker Discretionary Voting Allowed(2) | | | Impact of Abstain Vote | |
| Item 1 – The election of the | | | The affirmative vote of a |
| votes cast with respect to the director. | | | “FOR” “AGAINST” “ABSTAIN” | | | FOR | | | No | | | None | |
| Item 2 – The ratification of the appointment of Deloitte & Touche LLP as our independent registered public accounting firm for the fiscal year ending |
| February 1, 2025 | | | The affirmative vote of a majority of the voting power of the shares present in person or represented by proxy and entitled to vote on this item of business or, if greater, the vote required is a majority of the voting power of the minimum number of shares entitled to vote that would constitute a quorum at the Annual Meeting. | | | FOR | | | Yes | | | Against | |
| Item 3 – The non-binding advisory vote to approve our named executive officer | | | FOR | | | No | | | Against | | |||
| | Item 4 – Shareholder Proposal regarding Shareholder Opportunity to Vote on Excessive Golden Parachutes | | | AGAINST | | | No | | | Against | |
| (1) | If you are a record holder and you sign and submit your proxy card without indicating your voting instructions, your shares will be voted in accordance with the Board’s recommendation. |
| (2) | A broker non-vote will not count as a vote for or against a director and will have no effect on the outcome of the election of the eleven director nominees disclosed in this proxy statement. A broker non-vote will have no effect on Items 1, 3 and 4 unless a majority of the voting power of the minimum number of shares entitled to vote that would constitute a quorum at the Meeting is required in order to approve the item as described in the “Vote Required” column above, in which case a broker non-vote will have the same effect as a vote “Against”. |
| | | | | | | | | |||||
| | | 9 | | | | | 2024 Proxy Statement |
How do I vote?
If you are a shareholder of record (that is, if your shares are owned in your name and not in "street name"“street name”), you may vote:
| • | Via the internet at www.proxyvote.com; |
| • | By attending the virtual Meeting, which qualifies as being present in person, and voting online at www.virtualshareholdermeeting.com/BBY2024. |
If your shares are held in a brokerage account by a broker, bank or other nominee, you should follow the voting instructions provided by your broker, bank or other nominee.
If you wish to vote by telephone or via the internet, you must do so before 11:59 p.m., Eastern Time, on Monday,Tuesday, June 13, 2016.11, 2024. After that time, telephone and internet voting on www.proxyvote.com will not be permitted and any shareholder of record wishing to vote thereafter must submit a signed proxy card or vote in persononline during the Meeting. Shareholders of record will be verified online by way of the personal identification number included on a list held by the inspector of elections. "Street name" shareholders, also known as beneficial owners, must obtain atheir proxy from the institution that holds their shares, whether it is their brokerage firm, a bank or other nominee, and present it to the inspector of elections with their ballot in order to vote at the Meeting.notice card. Voting in person by a shareholder atduring the Meeting will replace any previous votes submitted by proxy.
How are my voting instructions carried out?
When you vote via proxy, you appoint the ChairmanChair of the Board, Hubert Joly,J. Patrick Doyle, and the Secretary of the Company, Keith J. NelsenTodd G. Hartman (collectively, the "Proxy Agents"“Proxy Agents”), as your representatives to vote at the Meeting. The Proxy Agents will vote your shares at the Meeting, or at any postponement or adjournment of the Meeting, as you have instructed them on the proxy card. If you return a properly executed proxy card without specific voting instructions, the Proxy Agents will vote your shares in accordance with the Board'sBoard’s recommendations as disclosed in this proxy statement. If you submit a proxy, your shares will be voted regardless of whether you attend the Meeting. Even if you plan to attend the Meeting, it is advisable to vote your shares via proxy in advance of the Meeting in case your plans change.
If an item properly comes up for vote at the Meeting, or at any postponement or adjournment of the Meeting, that is not described in the Meeting Notice, including adjournment of the Meeting and any other matters incident to the conduct of the Meeting, the Proxy Agents will vote the shares subject to your proxy in their discretion. Discretionary authority for them to do so is contained in the proxy.
How many votes do I have?
You have one vote for each share you own, and you can vote those shares for each item of business to be addressed at the Meeting.
How many shares must be present to hold a valid Meeting?
For us to hold a valid Meeting, we must have a quorum. In order to have a quorum, a majority of the outstanding shares of our common stock that are entitled to vote need to be present or represented by proxy at the Meeting. Your shares will be counted as present at the Meeting if you:
| | | | | | | | | |||||
| | | 2024 Proxy Statement | | | 10 | | | | |